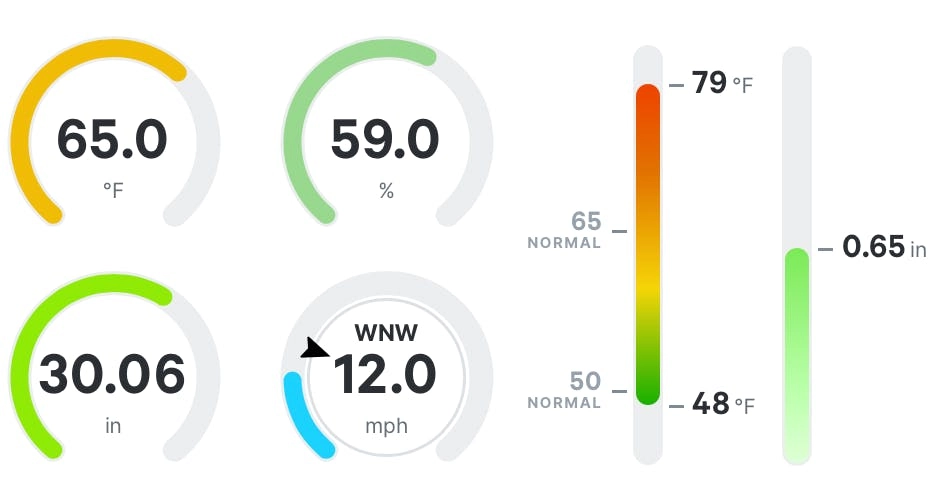
Visualize trends and collect insights
Every PWSWeather contributor receives access to a clean and beautiful dashboard allowing you to draw insights and uncover trends within your data. Easily visualize data any way you want with powerful and striking graphs and charts to tell the story of your weather data from day one.
Multiple third-party applications support utilizing data from PWSweather-compatible stations. We have detailed those on our Integrations page.
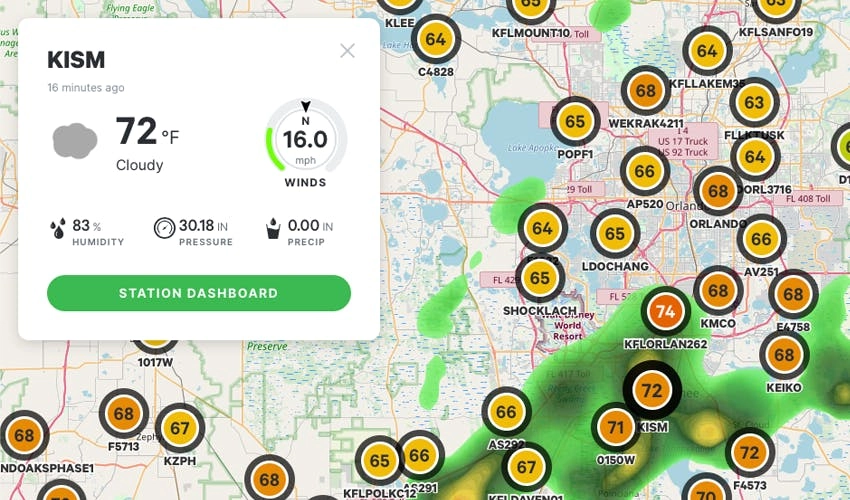
Track your data in real-time
Monitor any PWS on the PWSWeather network with Map View, which allows users to monitor accuracy, highlight microclimates, and view conditions anywhere in the world where a PWS or other weather station is located.

Your weather history, displayed beautifully
When you share your weather data with PWSWeather, you unlock the ability to archive and visualize long-term trends. View the full history of your data in aggregate or focus on key moments in your weather timeline by plotting data in graphs, charts, and other visualizations in real time.

Free access to the AerisWeather API
The most valuable benefit ($400+) of sharing your personal weather station data on PWSWeather is access to the AerisWeather Contributor Plan. As firm believers in the democratization of weather data and the impact it has on our everyday life, AerisWeather is generously providing extensive access to its Weather Data API and imagery for those who share data on the AerisWeather Station Network.
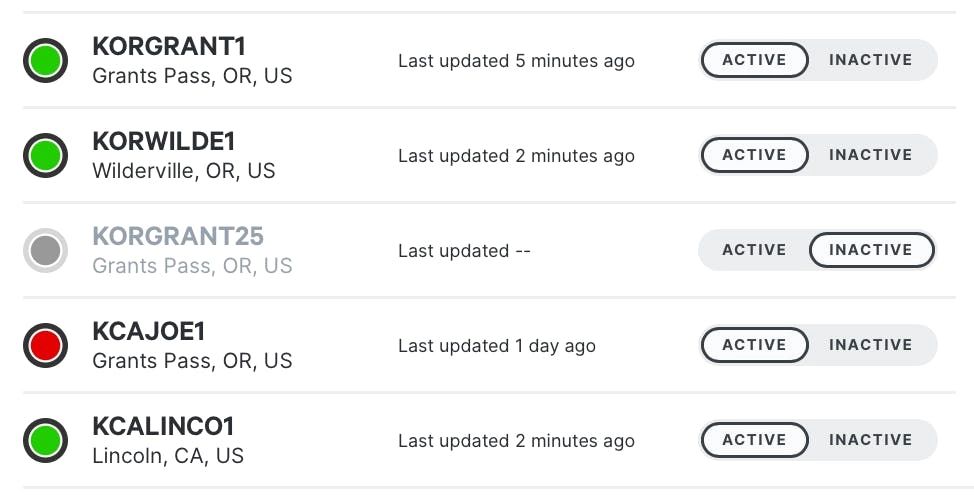
Station management at your fingertips
Manage all of your stations in one place with our Station Admin Panel. Keep track of when data was last sent, monitor conditions at each, and edit/add stations all from the same screen. Our interface features a simple setup to makes it quick and easy to monitor and change any PWS you have.